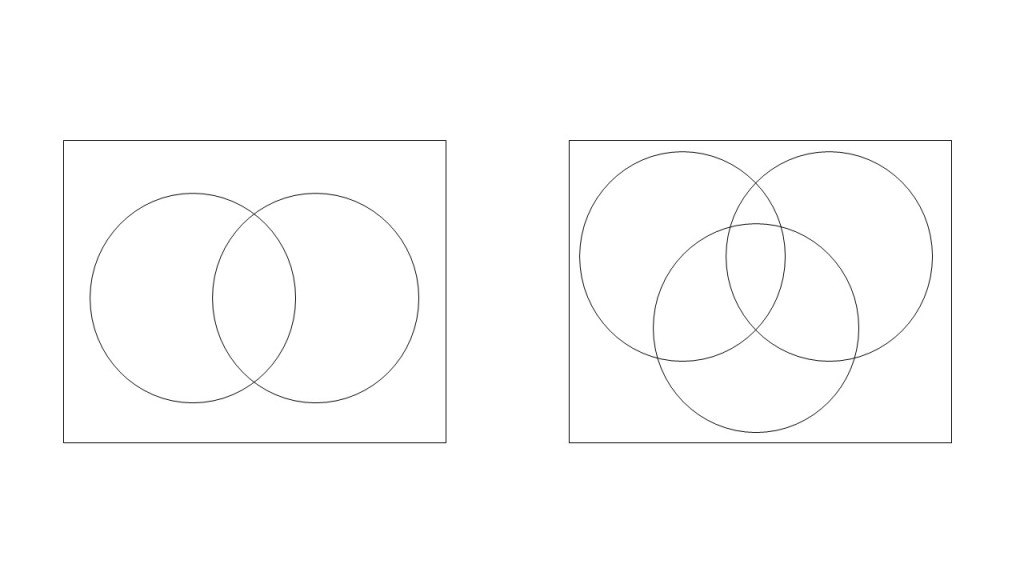
A Venn Diagram is a diagram made up of circles, surrounded by a rectangle which contain all of the frequencies or probabilities of each event happening. Where the circles intersect the probability of these events happening at the same time is displayed.
| Notation | Meaning |
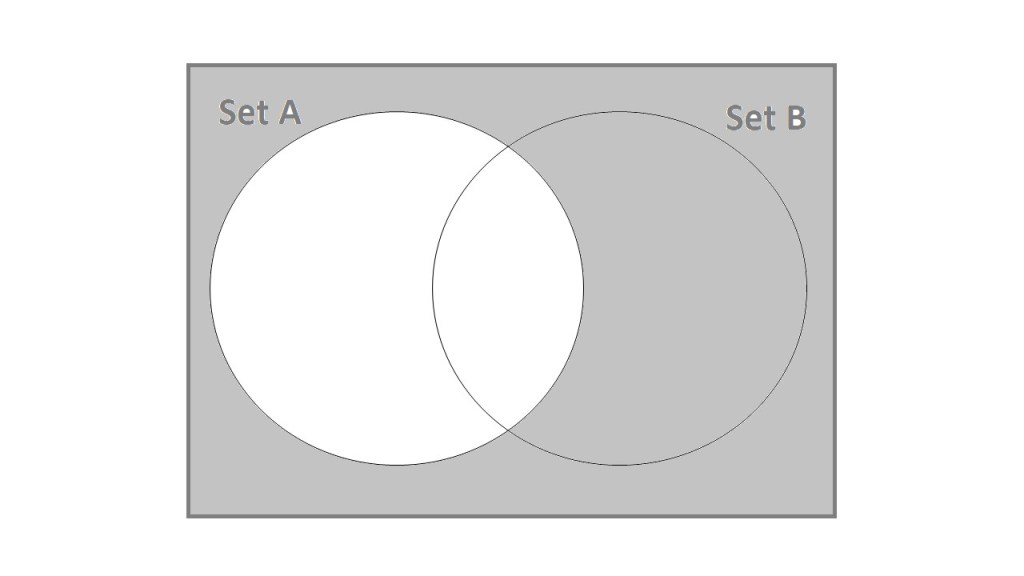
| P(A) | The probability of event A happening |
| P(A’) | The COMPLEMENT of A The probability of event A NOT happening |
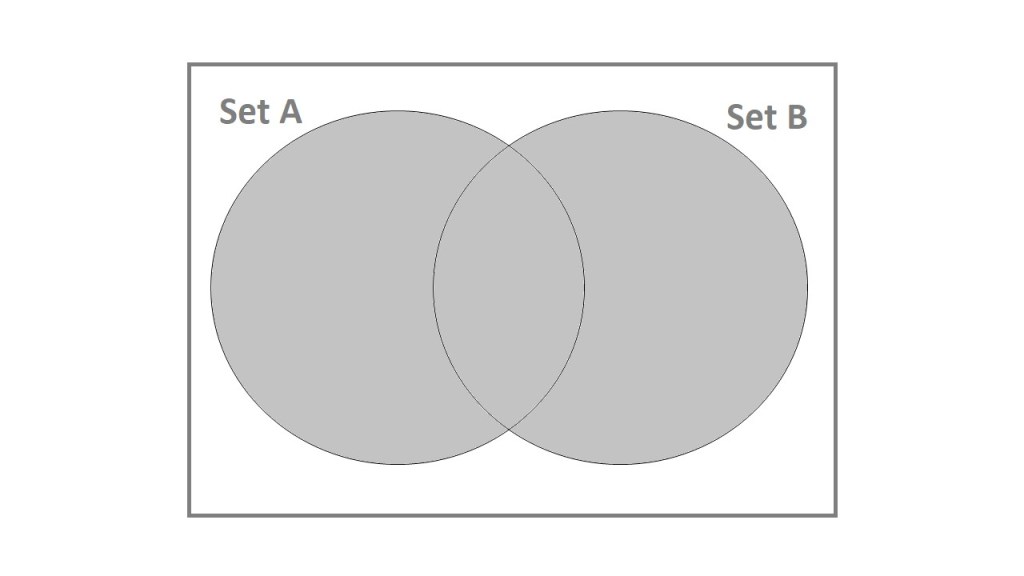
| P(AuB) | The UNION of A and B The probability of event A and event B happening or both |
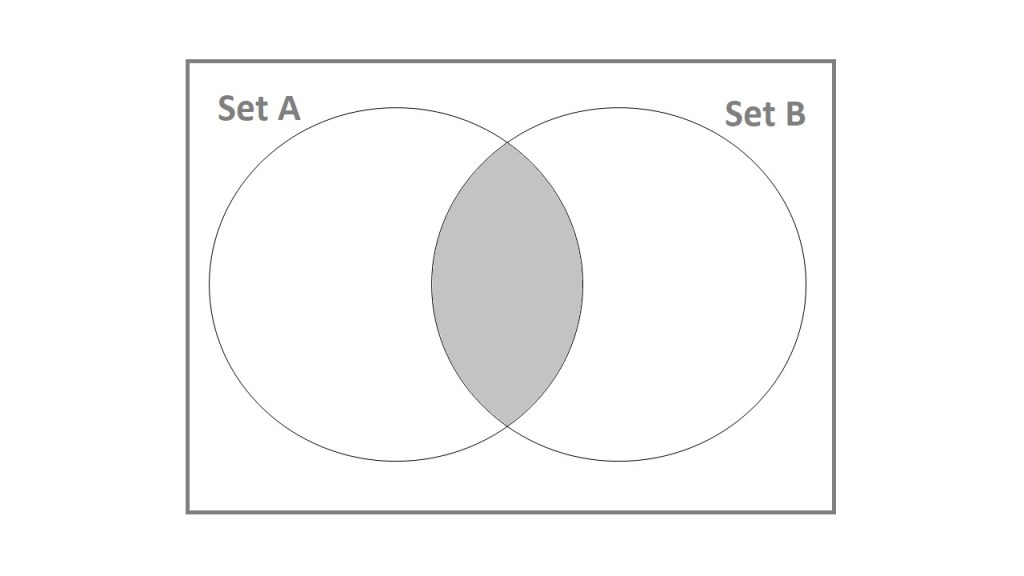
| P(AnB) | The INTERSECT of A and B The probability of both event A and event B happening |